
Automation for reports and dashboards is the automatic connection of business systems — CRM, finance, sales, marketing — to a single central dashboard that updates continuously and generates smart summaries using AI. Small and medium-sized business owners in Israel who implement this solution stop wasting hours every week on manual data consolidation and get an accurate picture of the business situation at any given moment — including automatic alerts when something deviates from the norm.
What is Automation for Reports and Dashboards?
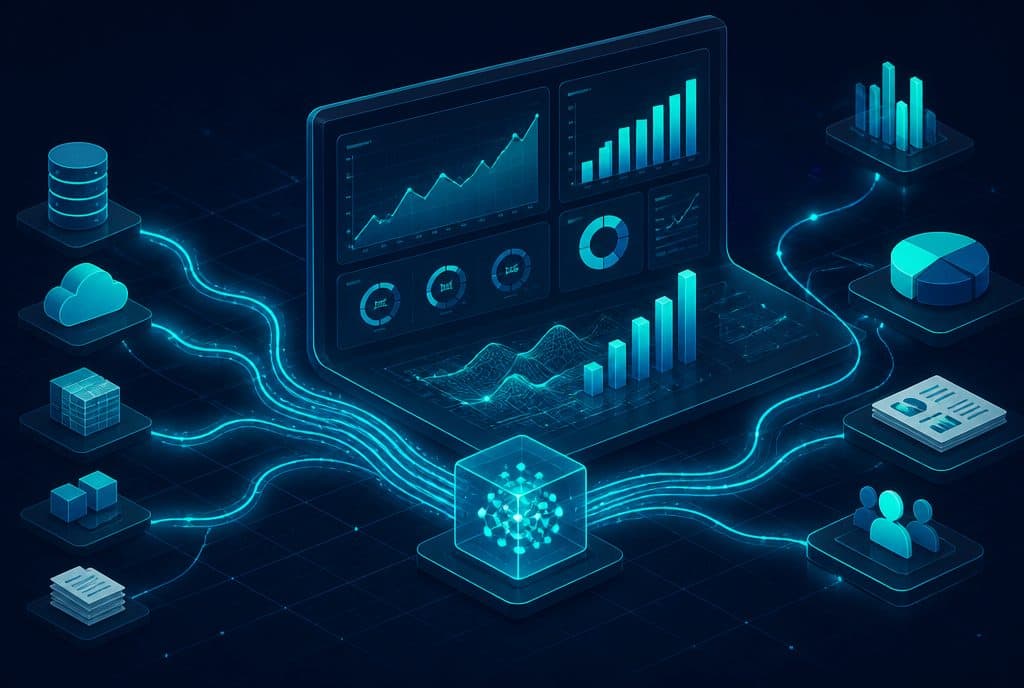
Automation for reports and dashboards is a system that connects all of the business's data sources — sales, leads, expenses, marketing performance — into one live dashboard, and runs AI that generates readable summaries, identifies data anomalies, and sends alerts via WhatsApp or email. Instead of the business owner manually collecting data from 4 different systems every week, the data arrives automatically, summarized and ready to read.
Why Manual Data Consolidation is a Problem
Most small business owners we meet work in a similar pattern: at the end of every week or month, they open an Excel sheet, export a report from the CRM, another report from the accounting system, check Google Ads and Meta — and try to assemble a single picture from everything. This process takes hours, is prone to errors, and ultimately produces a picture that is already outdated.
The second problem, which is less talked about: when data does not arrive in real-time, it is difficult to identify a problem early on. A lead that fell between the cracks, a sudden increase in customer acquisition cost in a campaign, or a sharp drop in sales in the middle of the month — all of these are discovered too late when the report only arrives at the end of the month.
Key Capabilities of an Automated Dashboard System
| Capability | What it actually means |
|---|---|
| Connecting Data Sources | CRM, accounting, Google Ads, Meta, e-commerce — everything comes to one place |
| Real-Time Updates | Data refreshes automatically, without manual export |
| AI Summaries | An AI engine generates a readable summary every day/week of what happened and what requires attention |
| Smart Alerts | When something deviates from the norm (a sharp rise in lead cost, a drop in revenue, a stuck lead) — the business owner receives a WhatsApp alert |
| Periodic Reports | A weekly/monthly report, ready and summarized, is automatically sent to email or WhatsApp |
| Tailored Permissions | A manager sees everything; an employee sees only the data relevant to their role |
How It Works — Four Steps
1. Mapping Data Sources We identify all the systems that hold relevant data for the business: CRM, accounting system, advertising platforms, online store, internal management system. For each system, we build an integration that pulls the required data.
2. Building Data Pipelines Using /en/services/automation, we build automated processes that pull data from each source, clean and unify it into a consistent format, and store it in a central database. The processes run in the background, without human touch, according to a defined schedule or in real-time.
3. Visual Dashboard + AI Summaries The unified data is displayed on a clear dashboard with graphs and key performance indicators (KPIs). An AI engine reads the data and generates a daily/weekly summary in natural language — what changed, what grew, what dropped, and what requires attention. There is no need to interpret graphs; the summary tells you exactly what matters.
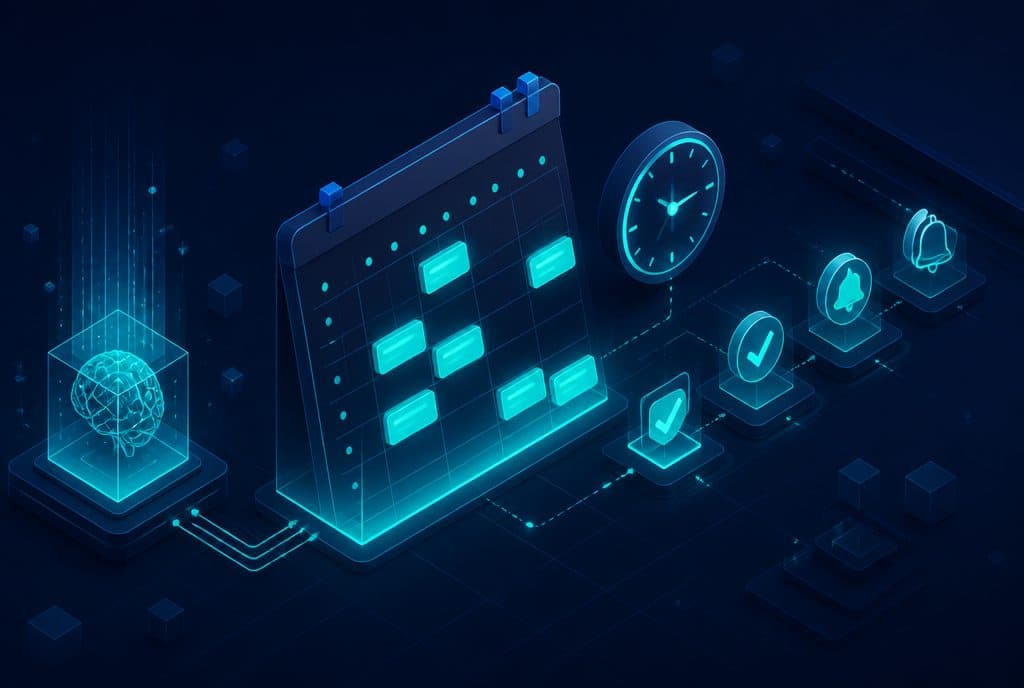
4. Proactive Alerts We define thresholds: if a lead's cost rises by more than X percent, if the calendar is empty for next week, if daily revenue drops below a certain threshold — the system sends an immediate alert to WhatsApp, email, or directly to the /en/services/smart-crm. You respond to problems before they worsen.
How to Get Started — Three Simple Steps
Step A: Listing the Systems — List all the systems that hold business data and decide which metrics are truly important for ongoing management (leads, revenue, customer acquisition cost, close rate).
Step B: Choosing One Leading Metric — Don't start with everything. Choose the metric that is most painful to track manually, and automate it first. This gives a quick, proven result and shows how the pipeline should work before expanding.
Step C: Defining Alerts — Decide what is "abnormal" for your business and what should trigger an alert. This definition is crucial: correct alerts deliver value; incorrect alerts turn into noise that gets ignored.
Want to understand which metrics you should optimize first? Talk to us and we will build an initial data map together — at no cost.
What is the Connection to CRM and AI Agents?
An automated dashboard works best when connected to the other two components of the digital management suite:
- Smart CRM — A properly managed CRM is the highest quality data source for the sales dashboard. When leads enter, update, and are tagged automatically in the CRM, the dashboard receives reliable and up-to-date data.
- AI Agents — An AI agent that manages conversations with customers writes actions to the CRM; the CRM feeds the dashboard; the dashboard sends alerts. The three components together create a self-managing feedback loop.
On the Privacy Protection Law and Data Security
When connecting systems and centralizing business data, legitimate questions arise regarding privacy and security. In Israel, the relevant legal basis is the Privacy Protection Law — not the European GDPR. The solutions we build are designed in accordance with the principles of the law: encrypted connections, minimal permissions for each component, and avoiding unnecessary storage of sensitive information.
If your business handles customer data (and who doesn't?), it is worth ensuring that the dashboard solution you set up is also based on these same principles.
How much does it cost?
| Component | Price (one-time setup, ex-VAT) |
|---|---|
| Connection to an existing system (CRM / Sheets / Monday) | ILS 2,500 |
| CRM / database you own | ILS 5,500 |
| Management dashboard | ILS 6,500 |
| Automatic customer journey | ILS 3,500 |
| Full operations system | ILS 22,500 |
A complete starting point — a WhatsApp AI agent including the business number, server and agent control room — is from ILS 10,200; an agent with a management system (CRM) from ILS 18,200, a multi-agent system from ILS 25,350. There is no monthly fee; third-party costs (server, messages, AI) of about ILS 100–500 a month are paid directly to the providers. The full component price list: pricing page.
Summary
Automation for reports and dashboards is not just another management tool — it is the change that shifts the business owner from a "reactive after the fact" state to a "seeing what's happening and making decisions in time" state. Instead of collecting data at the end of the month and discovering problems too late, the data comes to you, summarized, with clear alerts — and you are free to manage, not to report.
The first step is not technological — it is mapping: what metrics are important for you to see, where they come from, and what is "abnormal" for you. From there, we build the rest of the system.